
ScottPlot 是一个优秀的开源免费绘图控件,提供的多种图表样式。在测量中,使用ScottPlot绘制实时的示波器图形非常方便、简单以及有效。本文主要介绍在C#的WPF中,如何通过ScottPlot实现示波器图形(实时动态波形图)的绘制。

官方Demo下载地址:https://scottplot.net/demo/

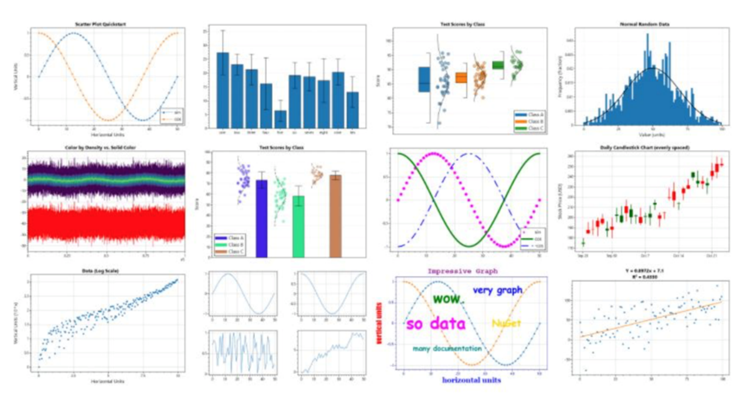
使用ScottPlot 可以做多种图表,
- 信号图 (Signal Plot) :具有均匀分布的Y点。信号图非常快速,可以交互显示数百万个数据点。有许多不同类型的可打印对象,每种对象都有不同的用途,还可以自定义轴标签和刻度范围。
- 散点图 (Scatter Plot) :具有成对的X/Y点;
- 柱状图 (Histogram) :一种以长方形的长度为变量的统计图表,其中一个轴表示需要对比的分类维度,另一个轴代表相应的数值,常用于统计数学中,对比分类数据的数值大小;
- 饼图 (Pie Chart) :是将数字比例表示为圆的切片,可以显示每一数值相对于总数值的大小,其中切片可以用值、百分比和标签以及图例进行标记;
- 气泡图 (Bubble Plot) :气泡图在特定的X/Y位置显示圆圈,每个圆圈都可以单独定制。气泡图与散点图相似,不同之处在于,气泡图允许在图表中额外加入一个表示大小的变量。实际上,这就像以二维方式绘制包含三个变量的图表一样。气泡由大小不同的标记(指示相对重要程度)表示。气泡图还可以与其他图类型组合,以创建更高级的图表;
- 雷达图 (Radar Chart) :也称为蜘蛛图或星图,可以简洁地显示多个值。可以设置没有轴线雷达图,也可以将“轴类型”更改为“多边形”,显示具有直线的雷达图,还可以设置类别标签、将标记值显示在在雷达图的臂上。
- 烛台图 (Candlestick Chart) :适用于金融行业,ScottPlot可以在X/Y空间的绘图上绘制一些财务指标,可以自定义蜡烛和灯芯的颜色等来实现暗模式财务图;
- 热图/强度图 (Heatmap) :默认情况下,热图将值显示为带有锐边的矩形。启用平滑功能使用双三次插值将热图显示为值之间的平滑渐变;
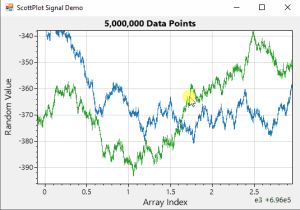
下面进入正题,实现在WPF中实时动态图(示波器图形)并鼠标右键添加垂线(VerticalLine)作区间展示以及实时更新VerticalLine的显示信息。支持可移动VerticalLine实时更新区间信息。
效果展示
实现细节
需要定义几个关键点:
1、实时绘图的数组,Y轴数据;
2、所有数据的List,从串口或其他方式来的所有数据;
3、实时绘图区绘制的点数Point,其实就是x轴有多少个点。
实现绘图,将数据点数Point作为要展示在当前页面的Double数组的长度,通过定时器轮询获取新数据来绘制实时图。定时器轮询的频率就是绘图UI的刷新率。
实现可移动的垂线(VerticalLine),需要给ScottPlot这个控件添加鼠标事件,右键点击(添加),左键点击(获取),鼠标松开(初始化VerticalLine对象),鼠标移动(移动VerticalLine)。
具体实现
1、Nuget安装ScottPlot.WPF控件
在NuGet包管理器中,选择“浏览”选项卡。搜索“ScottPlot.WPF”并选择这个包。点击“安装”按钮来添加包到你的项目。
2、Xaml文件添加ScottPlot控件并指定鼠标事件
xmlns:ScottPlot="clr-namespace:ScottPlot.WPF;assembly=ScottPlot.WPF"

<ScottPlot:WpfPlot Grid.Row="0" Grid.ColumnSpan="3" x:Name="myPlot1" PreviewMouseWheel="Window_PreviewMouseWheel"  MouseLeftButtonDown="formsPlot1_MouseLeftButtonDown" MouseRightButtonDown="formsPlot1_MouseRightButtonDown"  MouseUp="formsPlot1_MouseUp" MouseMove="formsPlot1_MouseMove"/>
3、定义成员变量
double[] dataY; //实时UI绘制时的数组
List<Double> listDataY; //所有数据的集合
int index; //要截取的索引
VerticalLine v1; //第一根垂直线
VerticalLine v2; //第二根垂直线
VerticalLine PlottableBeingDragged; //可变化的垂直线对象
int Point; //实时集合的长度以及实时绘制时的数据点数
4、初始化
Point = 400; //x轴绘制的点数
index = 0;
dataY = new double[Point];

//改变控件添加内部的鼠标的事件
ScottPlot.Control.InputBindings customInputBindings = new ScottPlot.Control.InputBindings()
{
    DoubleClickButton = ScottPlot.Control.MouseButton.Right,
    ZoomInWheelDirection = ScottPlot.Control.MouseWheelDirection.Up,
    ZoomOutWheelDirection = ScottPlot.Control.MouseWheelDirection.Down,
    PanLeftWheelDirection = ScottPlot.Control.MouseWheelDirection.Down,
    PanRightWheelDirection = ScottPlot.Control.MouseWheelDirection.Up,
    DragPanButton = ScottPlot.Control.MouseButton.Left,
    ClickAutoAxisButton = ScottPlot.Control.MouseButton.Right,

};

ScottPlot.Control.Interaction interaction = new ScottPlot.Control.Interaction(myPlot1)
{
    Inputs = customInputBindings,
};

myPlot1.Interaction = interaction;

//改变控件的背景颜色
var myPlot = myPlot1.Plot;

myPlot.ShowLegend();

myPlot.YLabel("mA");
myPlot.Title(deviceId);
myPlot.ShowLegend();

// change figure colors
myPlot.FigureBackground.Color = Color.FromHex("#181818");
myPlot.DataBackground.Color = Color.FromHex("#1f1f1f");

// change axis and grid colors
myPlot.Axes.Color(Color.FromHex("#d7d7d7"));
myPlot.Grid.MajorLineColor = Color.FromHex("#404040");

// change legend colors
myPlot.Legend.BackgroundColor = Color.FromHex("#404040");
myPlot.Legend.FontColor = Color.FromHex("#d7d7d7");
myPlot.Legend.OutlineColor = Color.FromHex("#d7d7d7");

//给集合赋值
Array.Copy(dataY, 1, dataY, 0, dataY.Length - 1);

dataY[dataY.Length - 1] = Double.Parse(data.current);

listDataY = dataY.ToList();


myPlot.Add.Signal(dataY);

//自定义X轴刻度ticks
ScottPlot.TickGenerators.NumericManual
ticks = new ScottPlot.TickGenerators.NumericManual();

// add major ticks with their labels
for (int i = 0; i < dataY.Length; i++)
{
    ticks.AddMajor(i, i.ToString() + "ms");
}
// tell the horizontal axis to use the custom tick generator
myPlot.Axes.Bottom.TickGenerator = ticks;

//y轴自适应
myPlot.Axes.AutoScaleY();
//清除右键选项
myPlot1.Menu.Clear();
//刷新
myPlot1.Refresh();
5、实时绘图,定时器执行的方法
var myPlot = myPlot1.Plot;
listDataY.Add(Double.Parse(data.current));
ScottPlot.TickGenerators.NumericManual ticks = new ScottPlot.TickGenerators.NumericManual();

//每进来一条数据就把数组的第一条数据给截取掉
if (listDataY.Count > int.Parse(Point))
{
    index++;
    int count = 0;
    Array.Copy(listDataY.ToArray(), index, dataY, 0, dataY.Length);

    //重绘刻度
    for (int i = index; i < listDataY.Count; i++)
    {

        if (count == 0)
        {
            ticks.AddMajor(count, i.ToString() + "ms");
        }
        if ((count + 1) % 10 == 0)
        {
            ticks.AddMajor(count, i.ToString() + "ms");

        }
        count++;
    }
}

myPlot.Axes.Bottom.TickGenerator = ticks;
myPlot.Axes.AutoScaleY();
myPlot1.Refresh();
6、鼠标事件实现
//鼠标松开事件
private void formsPlot1_MouseUp(object sender, MouseEventArgs e)
{
    PlottableBeingDragged = null;
    myPlot1.Interaction.Enable(); // enable panning again
    myPlot1.Refresh();
}

//鼠标移动事件
private void formsPlot1_MouseMove(object sender, MouseEventArgs e)
{

    Point p = e.GetPosition(myPlot1);
    Pixel mousePixel = new Pixel(p.X * myPlot1.DisplayScale, p.Y * myPlot1.DisplayScale);
    Coordinates coordinates = myPlot1.Plot.GetCoordinates(mousePixel);
    if (PlottableBeingDragged is null)
    {
        var lineUnderMouse = GetLineUnderMouse(coordinates.X);
        if (lineUnderMouse is null) Cursor = Cursors.Arrow;
        else if (lineUnderMouse.IsDraggable && lineUnderMouse is VerticalLine) Cursor = Cursors.SizeWE;
    }
    else
    {
        if (PlottableBeingDragged is VerticalLine v)
        {

            v.X = coordinates.X;
            v.Text = coordinates.X.ToString();

        }
    }
        myPlot1.Refresh();
}

//左键点击事件
private void formsPlot1_MouseLeftButtonDown(object sender, MouseButtonEventArgs e)
{
    Point p = e.GetPosition(myPlot1);
    Pixel mousePixel = new Pixel(p.X * myPlot1.DisplayScale, p.Y * myPlot1.DisplayScale);
    Coordinates coordinates = myPlot1.Plot.GetCoordinates(mousePixel);
    var lineUnderMouse = GetLineUnderMouse(coordinates.X);
    if (lineUnderMouse != null)
    {
        PlottableBeingDragged = lineUnderMouse;
        myPlot1.Interaction.Disable(); // disable panning while dragging
    }
}

//右键点击事件
private void formsPlot1_MouseRightButtonDown(object sender, MouseButtonEventArgs e)
{

    Point p = e.GetPosition(myPlot1);
    Pixel mousePixel = new Pixel(p.X * myPlot1.DisplayScale, p.Y * myPlot1.DisplayScale);
    Coordinates coordinates = myPlot1.Plot.GetCoordinates(mousePixel);

    if (v1 == null)
    {
        v1 = myPlot1.Plot.Add.VerticalLine(coordinates.X);
        v1.IsDraggable = true;
    }
    else
    {
        if (v2 == null)
        {
            v2 = myPlot1.Plot.Add.VerticalLine(coordinates.X);
            v2.IsDraggable = true;
        }
        else
        {

            myPlot1.Plot.Remove(v1);
            myPlot1.Plot.Remove(v2);
            v1 = null;
            v2 = null;
        }
    }
}

//获取当前鼠标下的垂直线对象
private VerticalLine GetLineUnderMouse(double x)
 {


            foreach (VerticalLine axLine in myPlot1.Plot.GetPlottables<VerticalLine>().Reverse())
            {
                double start = axLine.Position - 0.09;
                double end = axLine.Position + 0.09;
                if (x > start && x < end)
                {
                    return axLine;
                }
             }
             return null;
  }
Over